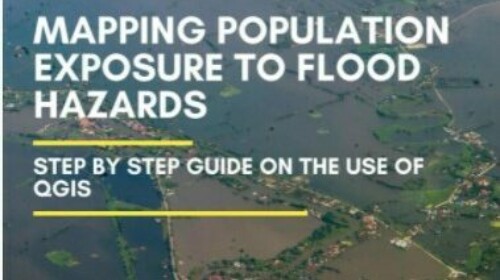
For illustrative purposes we have focused on one type of flood hazard, riverine floods and one geographical area, Lao People’s Democratic Republic. The maps generated are shown together with explanation of the applied methodology. The guide explains how to generate similar maps for hazard types and geographical areas of your own choosing.
The guide uses Copernicus Global Land Cover data, Census data and Administrative Boundaries data and Flood Hazard data to generate the maps shown. The guide explains the use of open-source software, namely Quantum Geographic Information System (QGIS) to construct the maps.
Related
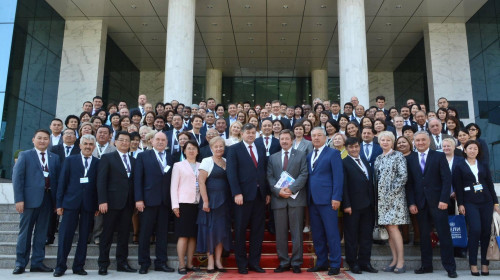
Empowering SDG progress: A Glimpse into the Kyrgyz Republic's SDG Monitoring
Microlearning
![]() Blog
Blog
Offered by:
Nazira Kerimalieva (First Deputy Chairman, National Statistical Committee (NSC) of the Kyrgyz Republic)
The Fight for Our Forests and Future
Microlearning
![]() Podcast
Podcast
Offered by:
Tyson Miller, Director (Earth Insight)


Transforming Economies for Sustainable Development
Course
Facilitated e-learning
5 Aug 2023
Offered by:
UNSSC


Raising Ambition - How to Set Science-Based Targets Aligning with 1.5°C Pathway
Course
Facilitated e-learning
Offered by:
SBT, UNGCA